| |||||||||||||||||

Introduction
This is a simple OCX control, which allows you to plot two-dimensional data. Despite the large set of controls that comes with VC++, there is no out-of-the-box control that provides a simple and straightforward 2D data visualization. The ActiveX control tutorial by Kapil Chaturvedi inspired me to write my own control, mostly because I wanted to customize the source code when needed. Over time, the functionality of the ActiveX control became more elaborate, and finally I made decision to publish what I have in hand.
What Can It Do?
The control is able to plot a large number of points and updating one or more plots on the graph with new data, replacing the old plot with the new plot. Multiple plots with individual properties such as name, line and point style, width, could be customized at runtime. At runtime, the control is capable of displaying its own property pages (double click on the control area or by invoking the ShowProperties method) and showing short help as a result of the user pressing F1 while the control has the focus. By setting the TrackMode property you should be able to switch between a different modes such as tracking cursor coordinates while moving (left mouse button pressed), zooming, XY-, X-, and Y-panning. Finally the control snapshot could be copied to the clipboard, printed, or saved as a bitmap file.What doesn't it do?
You cannot plot 3D data, but you can use the NTGraph3D ATL/STL/OpenGL activeX control to do that :-)!What's New?
- The Log Axes Mode works now, showing the log10 grid, and appropriated labels, it also converts the graph element's data
- The control's snapshot could be now saved as a bitmap file, many thanks to Robert Harber for providing the code!
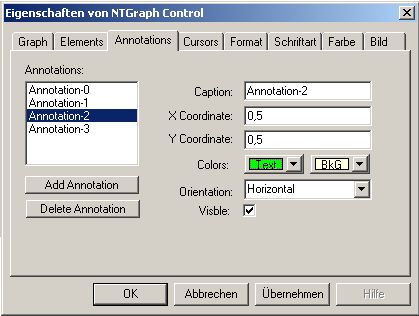
- Added abilities to dynamically creating annotation labels, that can be on different colors, orientations, and also could be hidden or visible.
- Added "Annotations" property page that provides fully access to the annotation list in the real/design mode.
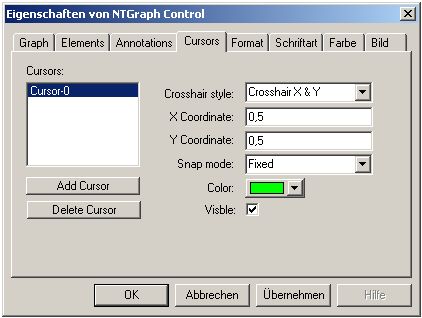
- Added abilities to dynamically drawing of multiply cursors, with a different colors, crosshair styles, floating/fixed, or snapped to the currently selected element!
- Added "Cursors" property page that provides fully access to the cursor list in the real/design mode.
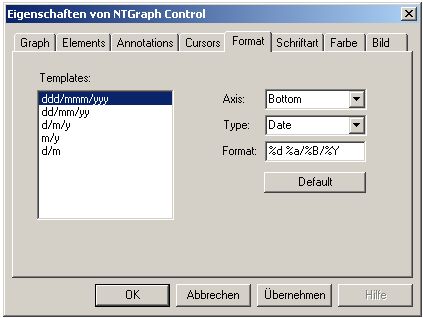
- Added axis formatting, that allows a customization of the bottom and left axis labels.
- Added "Format" property page that provides access to the axis format properties, and a templates for of commonly used data formats such a: Numbers, Exponential, Symbolic, Date, and Time!
- Added Time format for the graph axes. To use it, you should set the
XTime/YTimeproperty toTrue.
You also have to convert the date/time data todoubleformat. The Date/Time format is implemented as a as a floating-point value, measuring days from midnight, 30 December 1899. So, midnight, 31 December 1899 is represented by 1.0. Similarly, 6 AM, 1 January 1900 is represented by 2.25, and midnight, 29 December 1899 is 1.0. However, 6 AM, 29 December 1899 is 1.25.
For more info refer to MSDN for the class:COleDateTime!
How to test the control
You can use the ActiveX Control Test Container, and load the Test.dsm macro from the menu Tools\Macros... You can write your own routines to test the control behavior (look at Test.dsm macro)How to use the control
To use this OCX control, embed it in an application that supports the use of OCX controls. Microsoft Visual Basic applications, Office applications and applications created with the Microsoft Developer Studio�s AppWizard can support the use of OCX controls. There are two files required to use this control. They are:- NTGraph.hlp -The help file for this control.
- NTGraph.ocx -The NTGraph controls code and data.
Before the ActiveX control can be used in your application, it must be registered as a COM Component in the system registry. This is a self registering control. This means that to register the control in the system registry you only need to have an application load the control and call the control�s exported function DllRegisterServer. You can use the REGSVR32 utility or have your setup program do this.
How to use the REGSVR32 utility?
Copy NTGraph.ocx to your directory and type:
regsvr32 NTGraph.ocx regsvr32 /u NTGraph.ocx (Unregister server) Customizing TheControl
You can change the properties of this control during design time, or in run time to affect how the control will plot the data.Use the new control property pages:
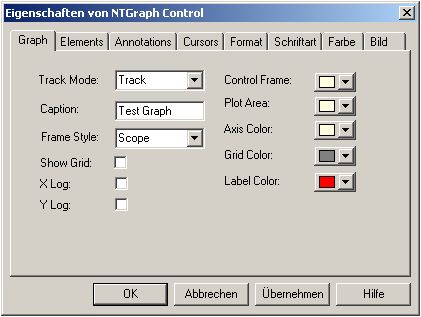
Graph Property Page
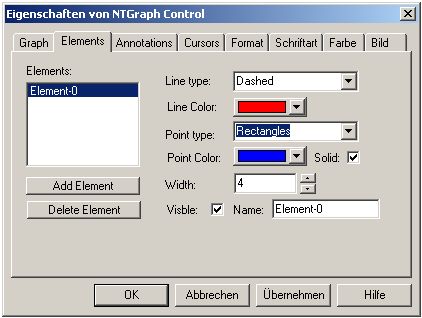
Elements Property Page
Annotations Property Page
Cursors Property Page
Format Property Page
You can include the control in your project by following the standard steps for ActiveX controls:
- Create MFC Dialog project or MDI/SDI project with View class derived from
CFormView - Choose menu Project|Add To Project|Components and Controls...
- Open the Registered ActiveX Control gallery
- Choose the
NTGraphControl and click Insert - Visual C++ will generate the class
CNTGraph - Then you can define variable of the type as
CNTGraph.
The control's customization options are straightforward:
// Customize Graph Properties m_Graph.SetBackColor (RGB(0,0,0));m_Graph.SetAxisColor (RGB(0,255,0));m_Graph.SetLabelColor (RGB(128,255,255));// Control's Frame and Plot area optionsm_Graph.SetFrameColor((RGB(0,0,0));m_Graph.SetPlotAreaColor(RGB(212,222,200));m_Graph.SetFrameStyle(2) // (1) - Flat // (2) - Scope (raised frame and sunken plot area borders) // (3) - 3DFrame (a bitmap frame picture) m_Graph.SetGridColor(RGB(192,192,192));m_Graph.SetShowGrid (TRUE);m_Graph.SetCursorColor (RGB(255,0,0));m_Graph.SetTrackMode (1);m_Graph.SetGraphTitle("XY Plot");m_Graph.SetXLabel ("X Axis");m_Graph.SetYLabel("Y Axis");m_Graph.SetRange(0.,10,-1,1.);You don't need to call the control Invalidate() function every time you change a Graph property. The changes are automatically reflected on the control appearance.
To load the data into the control...
////// Customize Graph Elements //// // The Graph elements are dynamically allocated! // Element 0 is allocated by default // Even after a call to the ClearGraph method, // the Element-0 is automaticaly allocated. m_Graph.SetElementLineColor(RGB(255,0,0)); m_Graph.SetElementLinetype(0); m_Graph.SetElementWidth(1); m_Graph.SetElementPointColor(RGB(0,0,255); m_Graph.SetElementPointSymbol(3); m_Graph.SetElementSolidPoint(TRUE); // Allocate a new element: Element-1 m_Graph.AddElement(); m_Graph.SetElementColor (RGB(0,255,0)); m_Graph.SetElementLinewidth(1); m_Graph.SetElementLinetype(2); // Allocate a new element: Element-2 m_Graph.AddElement(); m_Graph.SetElementColor (RGB(0,0,255)); m_Graph.SetElementLinetype(3); // Now change again the properties of Element-1 m_Graph.SetElement(1); m_Graph.SetElementColor (RGB(0,0,255)); ...//// Load Data int the Graph Elements // double y; for (int i = 0; i < NumberOfElements; i++) { for (int x = 0; x < NumberOfPoints; x++) { y = (double)rand() / RAND_MAX * 10.0; y = y / 3 + 10.0 / 2 * i + 1; m_Graph.PlotXY(x, y, i); // or PlotY(double data, long ElementID) } }The same story for Visual Basic Users:
With NTGraph1 .PlotAreaColor = vbBlack .FrameStyle = Frame .Caption = "" .XLabel = "" .YLabel = "" .ClearGraph 'delete all elements and create a new one .ElementLineColor = RGB(255, 255, 0) .AddElement ' Add second elements .ElementLineColor = vbGreen For X = 0 To 100 Y = Sin(X / 3.15) * Rnd - 1 .PlotY Y, 0 Y = Cos(X / 3.15) * Rnd + 1 .PlotXY X, Y, 1 .SetRange 0, 100, -3, 3 Next X End WithNTGraph Properties:
short AppearanceBSTR Captionshort AppearanceBSTR CaptionBSTR XLabelBSTR YLabelOLE_COLOR ControlFrameColorOLE_COLOR PlotAreaColorOLE_COLOR AxisColorOLE_COLOR GridColorOLE_COLOR LabelColorOLE_COLOR CursorColorIPictureDisp* ControlFramePictureIPictureDisp* PlotAreaPictureIFontDisp*LabelFontIFontDisp* TickFontIFontDisp* TitleFontIFontDisp* IdentFontFrameType FrameStyleshort XGridNumbershort YGridNumberboolean ShowGridboolean XLogboolean YLogdouble XCursordouble YCursorElements
short Elementshort ElementCountOLE_COLOR ElementLineColorOLE_COLOR ElementPointColorLineType ElementLinetypeshort ElementWidthSymbolType ElementPointSymbolboolean ElementSolidPointboolean ElementShowTrackModeState TrackModeBSTR ElementNameboolean ElementIdentAnnotations
short Annotationshort AnnoCountBSTR AnnoLabelCaptiondouble AnnoLabelXdouble AnnoLabelYOLE_COLOR AnnoLabelColorboolean AnnoLabelHorizontalboolean AnnoVisibleCursors
short Cursorshort CursorCountshort CursorMode(0 - Fixed; 1 - Floating; 2 - Snapped to currentlly selected element)double CursorXdouble CursorYOLE_COLOR CursorColorshort CursorStyle(0 - Crosshair; 1 - X hairline only; 2 - Y hairline only;)boolean CursorVisibleFormat
boolean XTimeboolean YTimeBSTR FormatAxisBottomBSTR FormatAxisLeft
Graph
Methods
void SetRange(double xmin, double xmax, double ymin, double ymax)void AutoRange()void CopyToClipboard()void PrintGraph()void ShowProperties()Elements
void AddElement()void DeleteElement(short ElementID)void ClearGraph()double GetElementXValue(short index, short ElementID)void SetElementXValue(short index, short ElementID, double newValue)double GetElementYValue(short index, short ElementID)void SetElementYValue(short index, short ElementID, double newValue)void PlotXY(double X, double Y, short ElementID)void PlotY(double Y, short ElementID)Annotations
void AddAnnotation()void DeleteAnnotation(short AnnotationID)Cursors
void AddCursor()void DeleteCursor(short CursorID)
Graph
Tracking Mode constants
- None = 0
- Track = 1 Track cursor position (hold mouse button pressed)
- Cursor = 2 Cursor position by single click
- Zoom = 3 Unzoom (right mouse button click)
- PanXY = 4
- PanX = 5
- PanY = 6
Frame Style Constants
- Flat = 0
- Scope = 1 (raised frame and sunken plot area borders)
- 3DFrame = 2 (a bitmap frame picture)
Line style constants
- Solid = 0
- Dash = 1
- Dot = 2
- DashDot = 3
- DashDotDot = 4
- Null = 5
- XYStep = 6
- YXStep = 7
- Bars = 8
- Stick = 9
Symbol style constants
- Nosym = 0
- Dots = 1
- Rectangles = 2
- Diamonds = 3
- Asterisk = 4
- DownTriangles = 5
- UpTriangles = 6
- LeftTriangles = 7
- RightTriangles = 8
Yep, that's it!
 1242906571_2d Graph.zip
 1242906571_2d Graph.zip
Enjoy!
Send mail to nteofilov@yahoo.de with questions or comments about this article.
History
22 Nov 2002 - v1.0 Initial release
01 Dec 2002 - v1.1
- Added new method copy2clipboard.
- Added the ability to draw elements with a different number of points. (by A.Hoffman)
- New method added by A.Hoffman to Show/Hide the Graph Element
- Bug fix. Thanks to A.Hofmann for help.
- Fixed some drawing problems. Thanks to Judd.
- Added custom font support.
- Zoom Mode: Not implemented yet, but reserved.
26 Jan 2003 - v2.0 (Flicker Free versiton of the control)
- Thanks to Keith Rule for the class
CMemDC - ZoomMode Implemented.
- Added tooltip, showing current cursor position.
- Added new method
Autorange. - Added new property
ElementLinewidth. - Added new property
ElementLinetype. - Fixed some drawing problems.
- Added (Test.htm) a brief info on how to add the control to your web page.
09 Mar 2003 - v2.1
- PanMode Implemented.
- Modified
SetElementColor,SetElementLinewidth,SetElementLinetype, so that they accept as a first parameter the ElementID. - Fixed some drawing problems. Should be clean now.
- GDI leak Fixed.
01 Jun 2003 - v3.0 New release!
- Thanks to Chris Maunder for Colour Picker control
02 Aug 2003 - v4.0 Final release!
- Thanks to Robert Harber for the useful discussions, ideas and code.
- Thanks to tagi1 for fixing the printing font problem.
- Thanks to Judd for testing the control.
Note that since there are significant changes in the last release you should remove (first unregister and than delete) all old versions of the control from your projects! The VBA users who use the control inside of Office applications should also remove the following file NTGRAPHLib.exd in the Temp directory of your computer. This file is automatically created by the Office application and saves properties of the former created control instances. You have to delete this file before you insert the new version of the control, in order to get correctly names in the property browser.
License
This article has no explicit license attached to it but may contain usage terms in the article text or the download files themselves. If in doubt please contact the author via the discussion board below.
A list of licenses authors might use can be found here
About the Author
Nikolai Teofilov Member |
|
'기본 카테고리' 카테고리의 다른 글
| edwin에서 자주쓰이는 기능만 추려 정리. SICP (0) | 2009.06.28 |
|---|---|
| 3D Graph ActiveX Control (0) | 2009.05.21 |
| A C++ implementation of an improved contour plotting algorithm (0) | 2009.05.20 |
| Fault-tolerant 시스템과 Erlang (0) | 2009.05.20 |
| 구글 안드로이드 플랫폼 아키텍처 (0) | 2009.05.19 |